How We Rank Secondary Schools
The rankings we use on our website are based on publicly available VCE performance data from the Victorian Curriculum and Assessment Authority (VCAA). We aim to present a fair, balanced, and easy-to-understand ranking that highlights genuine differences in academic outcomes. To achieve this, we focus on two key indicators that capture different aspects of performance for each school:
- Median VCE Study Score - a measure of overall student achievement
- Percentage of Study Score of 40 and above - indicating high-end academic excellence
Metrics Used
Median VCE Study Score
The median study score represents the midpoint of all study scores achieved by students at a school. Because it is unaffected by extreme highs or lows, it provides a stable and reliable measure of typical student performance.
Percentage of Study Scores 40 and Above
This metric shows the proportion of students who achieved a study score of 40 or higher—an exceptional level of performance that places a student among the top 8% in the state. This measure highlights a school’s ability to extend capable students and produce high-achieving graduates. Although the distribution is right-skewed (most schools have low percentages and a few have high ones), the variation remains stable and suitable for comparative analysis.
What Are Z-Scores and Why Do We Use Them
To combine these two different metrics fairly, we convert each one into a z-score. A z-score measures how far a school’s result sits above or below the statewide median (or mean, for percentage 40+) in standard deviation units.
This approach:
- puts both metrics on the same scale,
- prevents any single measure from dominating the ranking,
- recognises exceptional performance meaningfully, and
- allows comparison across all schools in Victoria, regardless of size or sector.
Statistical checks across multiple years and sectors confirmed that both metrics behave consistently and are suitable for z-score normalisation.
Combining the Metrics
Each school receives:
- a z-score for its median VCE study score, and
- a z-score for its percentage of study scores of 40 and above.
These are then combined by addition to produce the school’s overall ranking score. This balanced approach rewards both strong overall achievement and the ability to support high-performing students. Performance bands can then be applied to the combined z-score to illustrate relative standing in a statistically defensible way.
Defining Performance Bands
The z-scores provide a standardised measure of academic performance that allows us to group schools into performance bands. These bands show how far each school sits from the statewide average and can be colour-coded, making the map intuitive and easy to interpret.
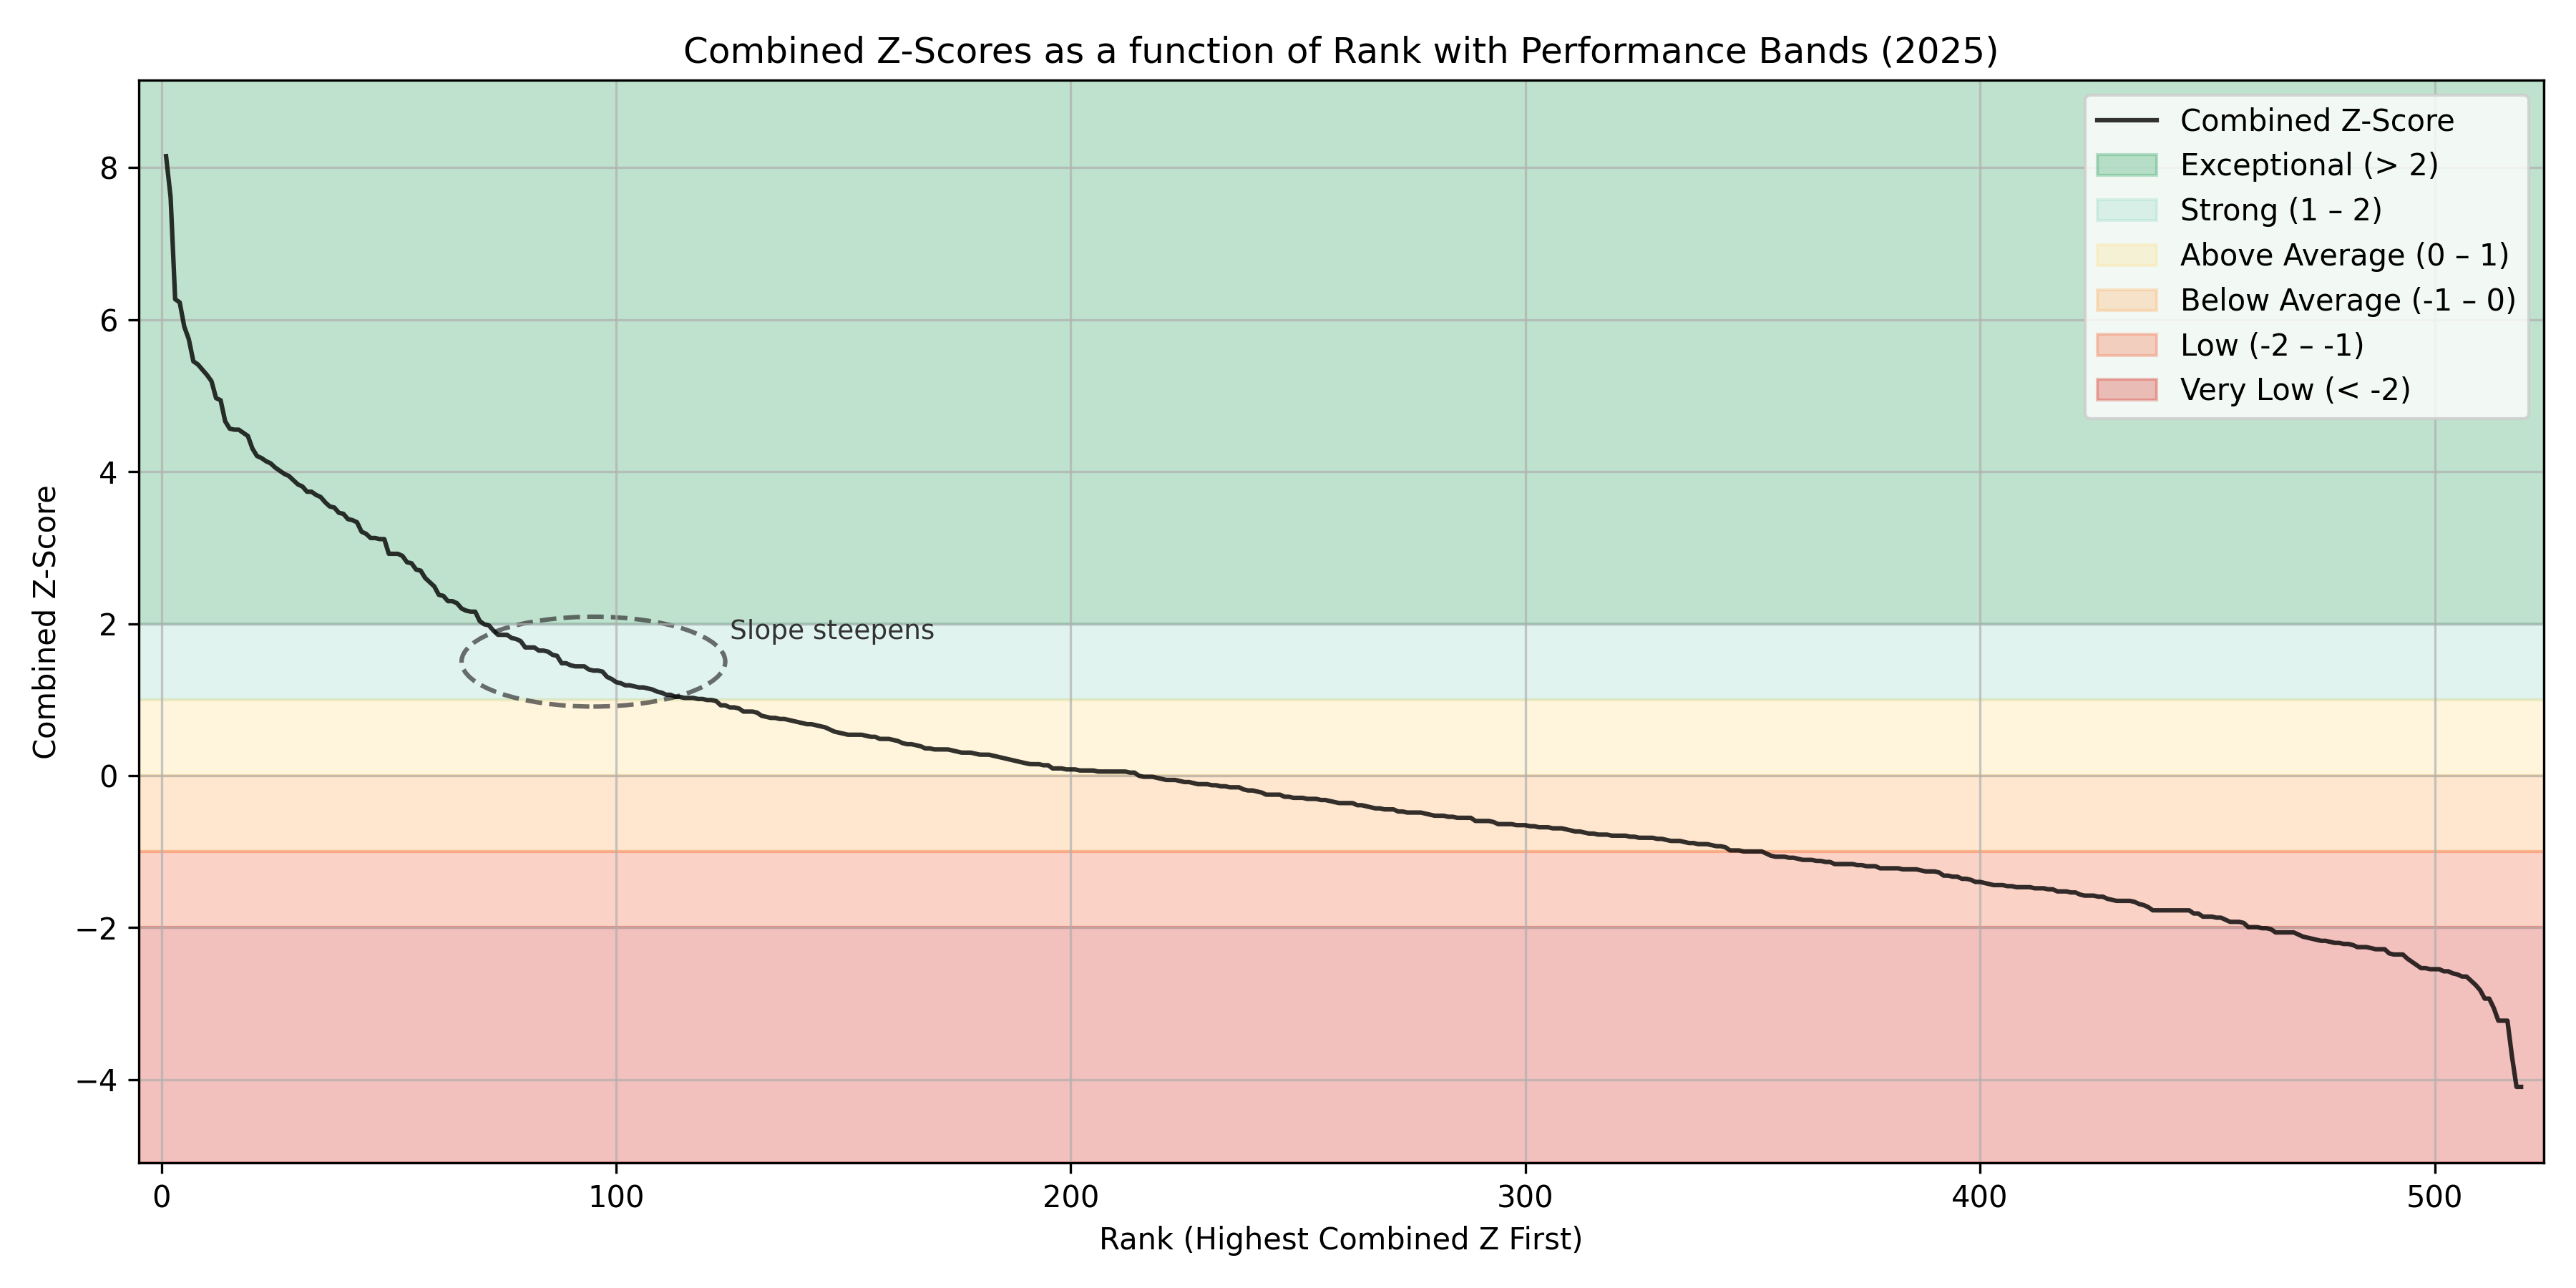
To define these performance bands, we look at how combined z-scores change as school rank improves. When we plot this relationship, a natural transition point (“knee”) appears between 1 and 2 standard deviations above the mean. At this point, the slope of the curve begins to steepen — meaning the difference in performance between each successive school becomes noticeably larger.
In practical terms, schools in this range begin to pull away from the rest: their median VCE scores and the percentage of students achieving a study score of 40 or above rise more sharply than those of schools below them. A similar transition occurs at the lower end of the distribution. When combined z-scores fall below –2, the curve bends downward more distinctly, indicating that each successive school performs increasingly worse than the one before it. This marks a clear shift into the lowest performance band.
Taken together, the natural inflection points in the combined z-score curve and the deviation from the statewide mean, these patterns provide an empirical basis for defining the performance bands. Rather than relying on arbitrary percentile cut-offs, the bands reflect where the data itself shows meaningful changes in academic performance. Using these transition points, and considering overall results relative to statewide benchmarks, the performance bands are defined as follows:
| Z-Score Bin | Label | Notes |
|---|---|---|
| > 2 | Exceptional | Top performing schools, clearly above peers |
| 1 – 2 | Strong | Strong academic performance, significantly above average performance |
| 0 – 1 | Above Average | Slightly above the mean |
| -1 – 0 | Below Average | Slightly below the mean |
| -2 – -1 | Low | Noticeably below peers |
| < -2 | Very Low | Well below peers |
Sector and Year Comparisons
Rankings are calculated across all Victorian schools within a given year. Differences between sectors (government, Catholic, independent) are not adjusted or imposed; they emerge naturally from the data.
Because variation within each sector is generally larger than differences between sectors, the z-score approach allows fair comparisons across all schools. Rankings are produced separately for each year to reflect actual performance, with no smoothing or multi-year averaging applied.
Transparency and Limitations
The ranking reflects academic outcomes only and does not measure factors such as wellbeing, teaching quality, facilities, extracurricular programs, diversity, or school culture. Academic results are just one dimension of a school, and families are encouraged to consider multiple factors when choosing a school.